


Create the exact report you have in mind
Pick a field - region, cost centre, account manager. One execution produces one report per value, each filtered and matched to its recipient.

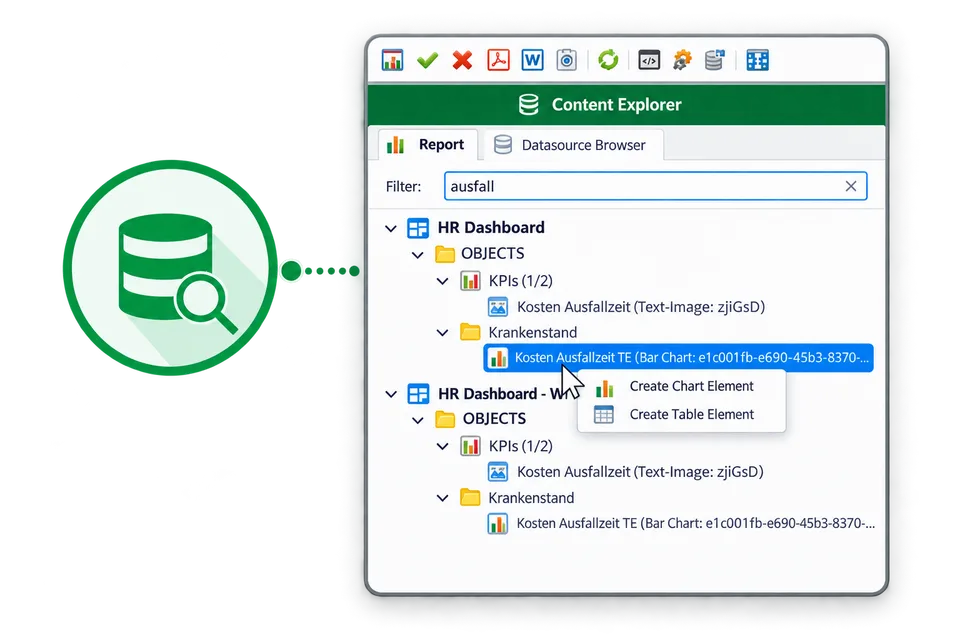
Data source browser
The data source browser lists the objects of the connected data source. Find an object and add it to your report with a double-click. The browser reads the structure of a connected datasource - fields, variables, visualisations and embedded reports - and inserts the selected object into the template with its live binding intact.
- Add a data object with a double-click
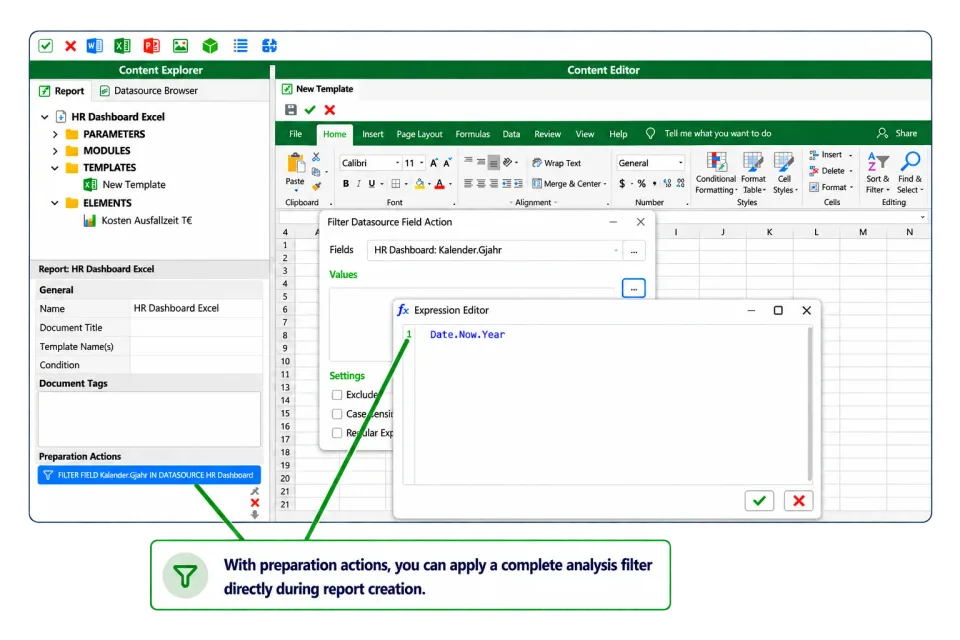
Data filtering
Define filters and use them in your reports. Filters are evaluated at execution time through parameters and expressions, which lets one template produce a separate, correctly filtered document for every recipient.
- Define filters and use them
Good to know: A field filter applies to the table or view that field belongs to. Related tables are not filtered automatically through foreign keys - where that matters, put the logic in a view your data team maintains.
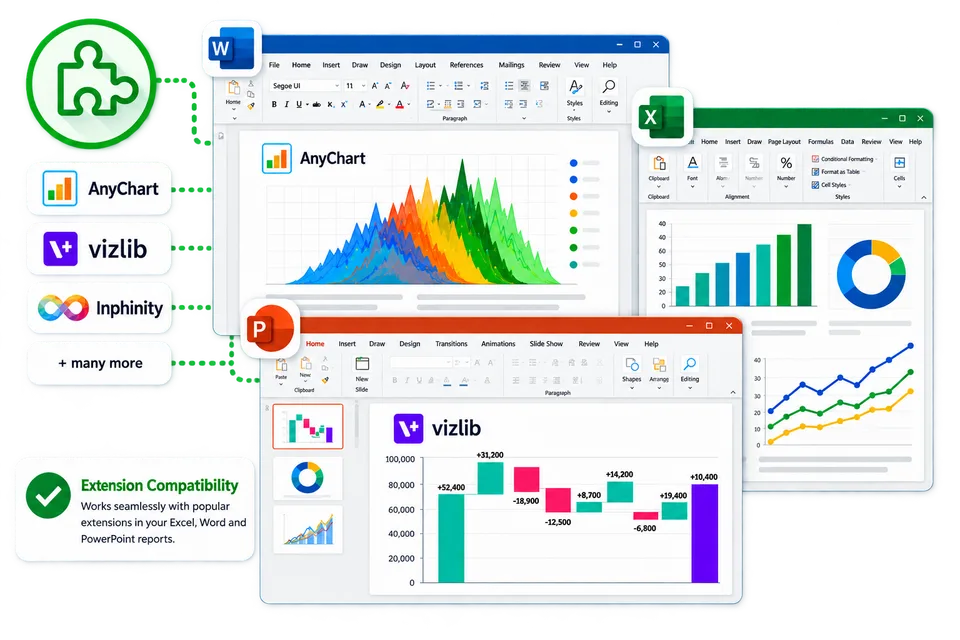
Extension compatibility
Renders Vizlib, AnyChart, Inphinity, ks quadrat and trueChart into every output format.
- Vizlib, AnyChart, Inphinity, ks quadrat, trueChart, Qlik bundles
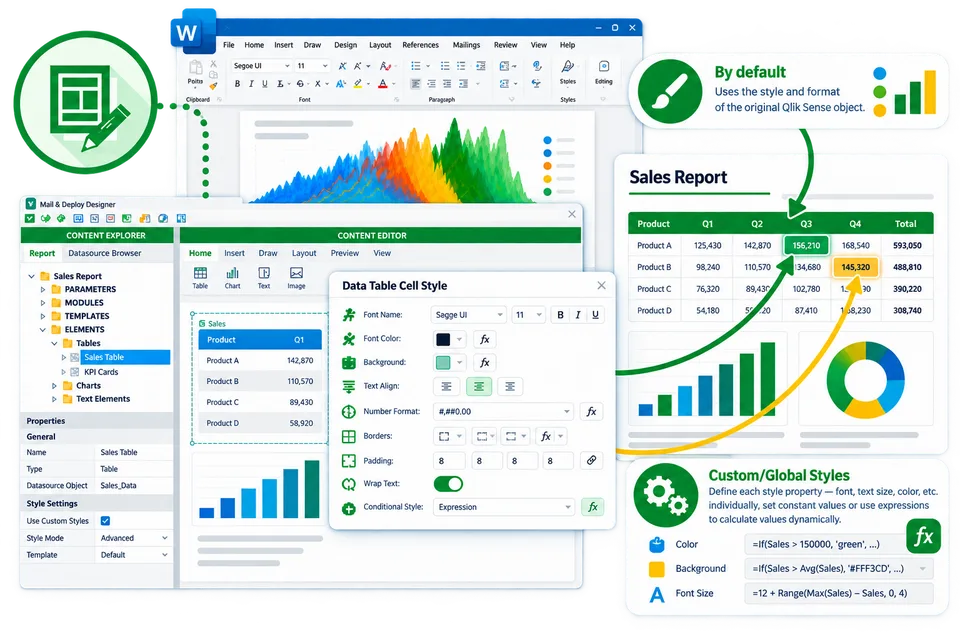
Advanced report customisation
Use expressions, cultures, conditions and cell formatting to create tailored, data-driven reports. Layout, formatting and visibility can be driven by expressions, so sections appear or change depending on the data of the current execution.
- Expressions, cultures, conditions and cell formatting
Book a Mail & Deploy workshop
Build your reporting skills with guided, hands-on training. Work through connecting data sources, creating reports and setting up distribution with a Mail & Deploy consultant.
Workshops cover both client-managed and SaaS versions of Mail & Deploy. Choose the session format that fits your team.