


Optimise and plan reporting resources
Every execution is logged: what ran, what it produced, where it went, what failed.
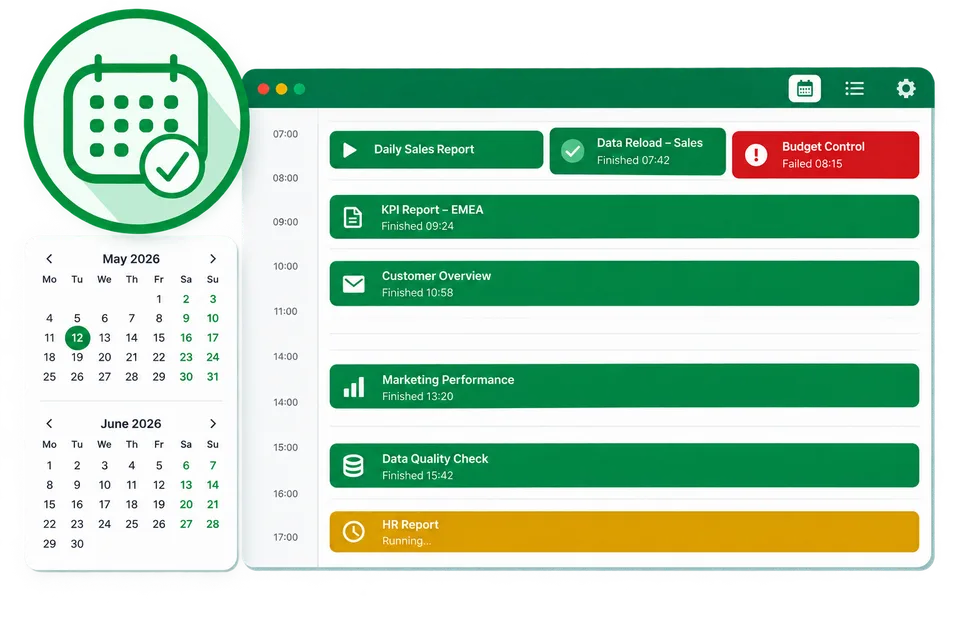
Execution calendar
The calendar shows executed tasks in one view.
- Past executions in one view
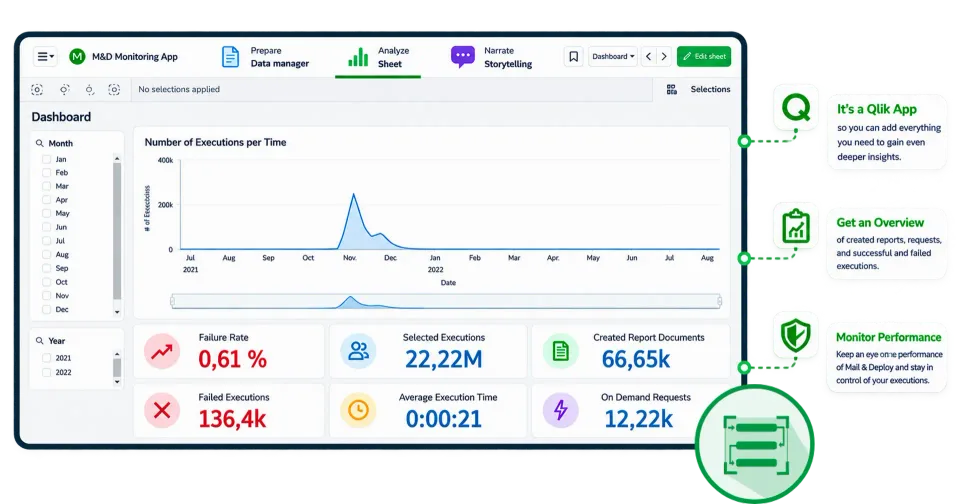
Usage monitoring
The execution status lists every running execution with its log file, and an execution can be aborted individually or all at once. The Monitoring App shows how Mail & Deploy is used: executions, requests and reports, each with its log file.
- Executions, requests and reports with log files
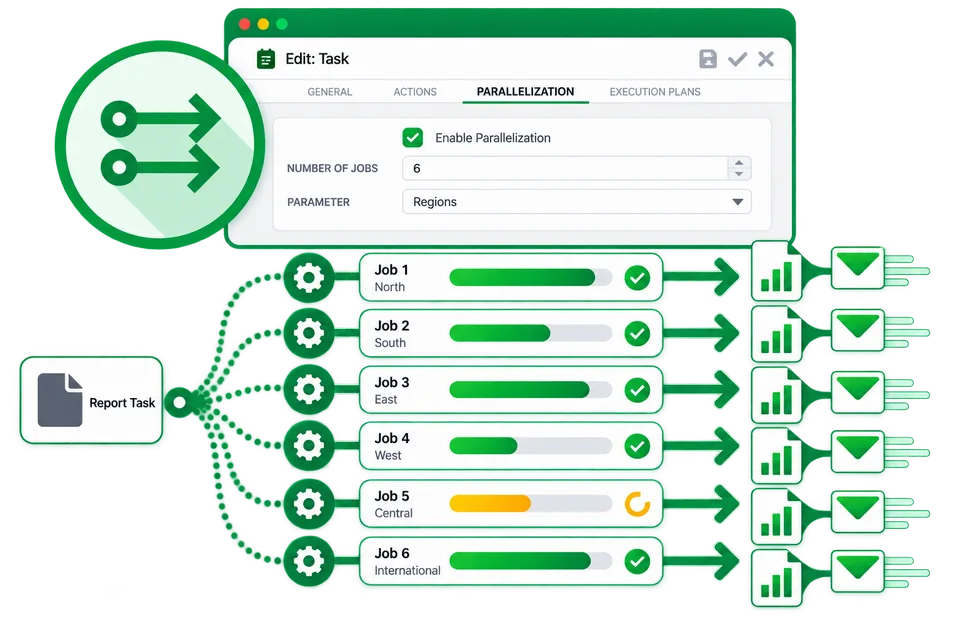
Parallel report execution
The engine is multi-threaded and processes a large number of reports in parallel. A task parameter is split evenly across the configured number of jobs, and the task only starts when enough execution slots are free for all of them.
- Multi-threaded engine, tasks execute simultaneously
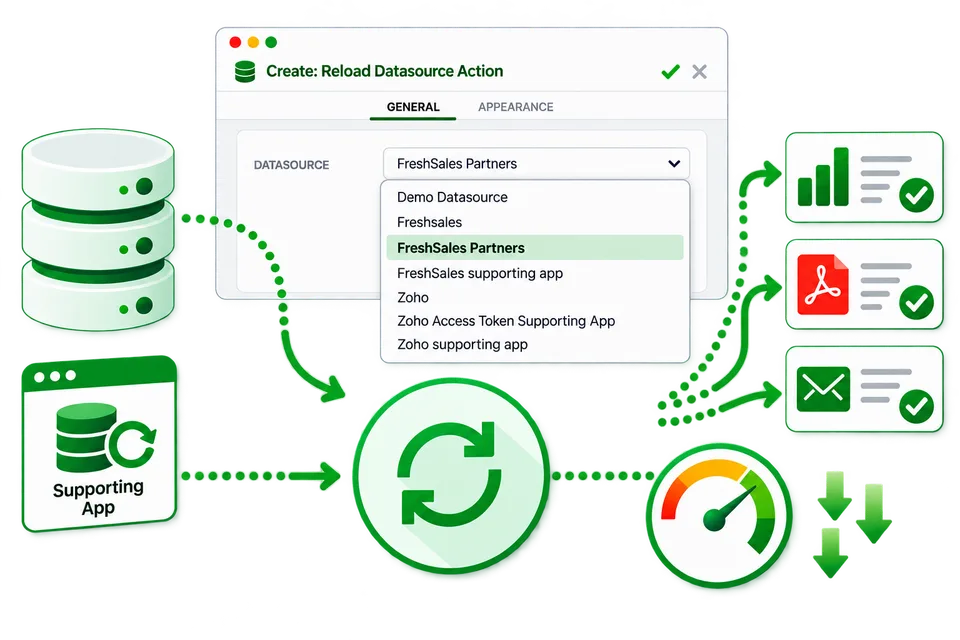
Reload and reduce automation
Reload and reduce documents and applications automatically before reports are created and distributed.
- Reload and reduce run before the report is generated
Alerts
An alert checks a condition in a datasource on a regular schedule - for example, whether yesterday's revenue fell below a threshold - and sends an e-mail to the user when the condition is met. It can check the condition once or for every value of a field, such as each region, and lists the values that triggered it. Users manage their own alerts in the Mail & Deploy Hub.
Book a Mail & Deploy workshop
Build your reporting skills with guided, hands-on training. Work through connecting data sources, creating reports and setting up distribution with a Mail & Deploy consultant.
Workshops cover both client-managed and SaaS versions of Mail & Deploy. Choose the session format that fits your team.